Model leaderboards can't see the harness
Endor Labs ran the same model through two harnesses in one week and got a 25.7-point swing — wider than the spread across the whole top of the leaderboard it would be ranked on.
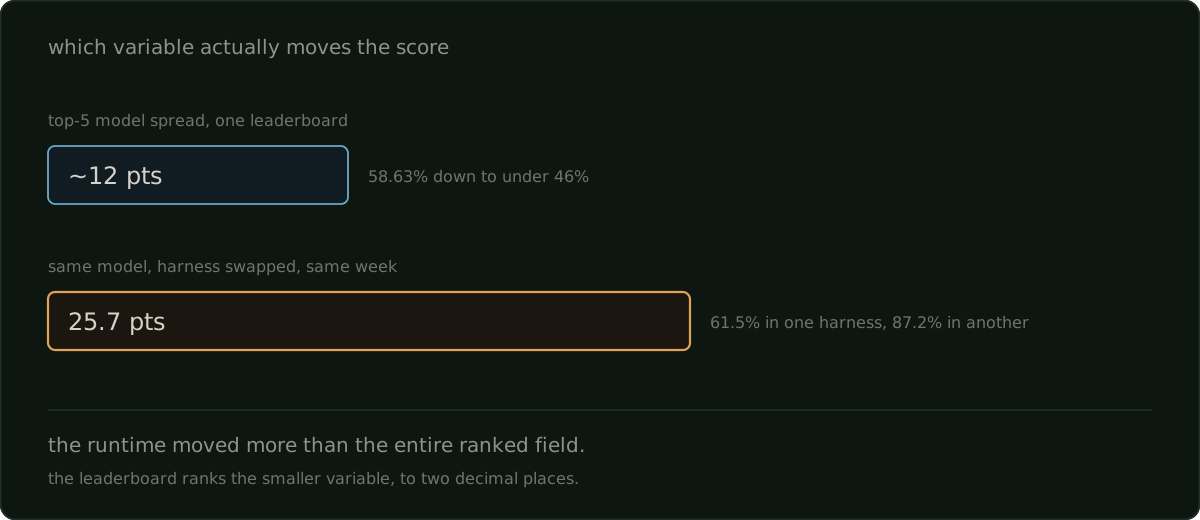
Endor Labs ran the same models through two different harnesses in the same week. GPT-5.5 scored 61.5% functional correctness inside OpenAI's own Codex harness and 87.2% inside Cursor's. Same model, same week, same task family. A 25.7-point swing that came entirely from the runtime around the weights.
Tomasz Tunguz surfaced that on July 28, and there is a second detail in it that should bother anyone who assumes a lab knows its own model best: both frontier models scored better in a competitor's harness than in their maker's. Opus 4.7 came in at 87.2% in Claude Code against 91.1% in Cursor. The first-party-harness advantage is an assumption people repeat. It is not a measurement.
Put the swing next to the leaderboard
Here is the arithmetic that reframes it, and it is my claim rather than anybody's press release.
A 25.7-point harness swing is larger than the gap between the top five models on most leaderboards — usually by a wide margin. Look at Vals AI's Finance Agent v2, updated a week earlier on July 22: Claude Opus 5 takes first place at 58.63% across 927 expert-reviewed questions, all-pass 47.71%, and everyone else lands under 46%. So the entire visible field, first to fifth, fits inside roughly a dozen points.
The runtime moved twice that. Which means the variable that decides your outcome is not the one the leaderboard is ranking, and the ranking is being published to two decimal places while the larger variable is not measured at all.
That is not an argument that benchmarks are worthless. It is an argument about what kind of claim a benchmark licenses. A rank says: in this sandbox, with these scaffolding choices, this model came first. It does not say the ordering survives a change of harness, and the Endor numbers say plainly that it often does not.
Where the production levers actually sit
The same Tunguz post carries two other numbers that point the same direction. Input tokens are 86–98% of OpenRouter traffic — meaning what you feed the model dominates what you spend. And a 500-session caching study (Lumer et al., arXiv:2601.06007) cut costs 41–80% purely at the harness layer, without touching the model.
Cost, correctness, latency. The three things a buyer actually cares about, and all three move most at the layer nobody is ranking. The model is the component you choose once; the harness is the component you tune continuously, and the tuning has more range than the choice.
Two caveats matter to the comparison. Endor Labs' underlying publication came to me through Tunguz's footnote rather than fetched directly, so I am one hop from the primary on the headline number. And a claim circulating alongside the Vals result — that Finance Agent v2 offers no Excel and no licensed data feeds — was not visible on the Vals page itself. Treat that one as secondhand; I could not confirm it.
What this does to a bake-off
At Trigent the standard model selection exercise is built exactly the way you would expect. Fix the scaffolding, swap the model, score the outputs, rank them, recommend the winner. It produces a table that looks rigorous and travels well in a deck.
The trouble is that the fixed scaffolding is usually whatever the team built first — a retry policy someone picked, a context window someone set, a tool-calling pattern inherited from a tutorial. That configuration is not neutral. It is one point in a space that Endor's numbers say spans twenty-five points, and every model in the comparison is being scored through it.
So the "winning model" is frequently the model that happens to suit the scaffold you already had. Change the scaffold and the ranking can inverse — which is a deeply unsettling thing to discover after you have signed a contract on the strength of the table.
What I do now is cheap and it changes conversations: before comparing models, run one model through two harness configurations and look at the spread. If that spread is comparable to the spread between your candidate models, the bake-off is not measuring what the deck says it is measuring, and everyone in the room can see it in one chart. It reframes the meeting from "which model" to "what are we holding constant, and why that."
The uncomfortable read for buyers
There is a commercial edge to this. Labs publish model ranks because models are what labs sell. Nobody is incentivised to publish the harness sensitivity of their own benchmark, because the honest version of that chart makes the headline rank look fragile.
Meanwhile the aftermarket — Cursor, Codex, the agent frameworks, the caching layers — is where the measured gains keep landing, including on the labs' own models. That is a strange market: the component with the most leverage is the one with the least published measurement.
If you are buying, the practical move is to stop asking which model tops a list and start asking what the list held constant. A rank without a harness spec is a number missing its denominator, and I would treat it the way I treat any other unsourced statistic.
A leaderboard rank is a property of a sandbox, not of a model — ask what harness earned it before you let it pick your stack.