
The 12-agent adoption stat lost its denominator
Salesforce did publish the 12-agent survey. The error is the denominator: 1,050 IT leaders at 1,000-plus-employee enterprises became "the average company" for an SMB audience.
On September 10 I published an article saying the “average company runs about 12 AI agents” had no primary source. I was wrong. Salesforce published the survey, the sample and the field dates on February 5.
That does not rescue the way the number travelled into my inbox. It changes the failure mode. The source did not disappear; its population did. This is denominator drift, not an unsourced statistic.
The old URL stays because the public record should not quietly move when the argument does. Read the slug as the scar; the visible title now states the corrected finding.
The source I missed
Salesforce’s 11th Connectivity Benchmark announcement reports three numbers that arrived together in the newsletter: organisations used an average of 12 agents, expected that count to rise 67% within two years, and said 50% of agents operated in isolated silos rather than as part of a multi-agent system.
The methodology is unusually specific. Vanson Bourne interviewed 1,050 IT leaders online in October and November 2025 across nine markets. Every respondent was an IT manager or above, and every one worked at an enterprise with at least 1,000 employees. The survey was double-anonymous; Salesforce published it with Deloitte Digital input and a MuleSoft product argument.
So there is a named instrument, a sample, a population and field dates. My search stopped too early at compilation pages and a Gartner result. “I could not find the source” became “there is no source,” which is a larger claim than my work licensed.
The exact 12-agent and 50%-siloed pairing leads directly to Salesforce. Searching the broad category phrase can miss the original source; search failure does not establish that a claim has no source.
The number changed populations
The newsletter calls itself “AI Strategy for SMB Leaders Who Don’t Have Time to Waste.” In that setting, “the average company now runs about 12 AI agents” sounds like a general business baseline. The Salesforce number is not that. It is what surveyed IT leaders at 1,000-plus-employee enterprises reported about their organisations.
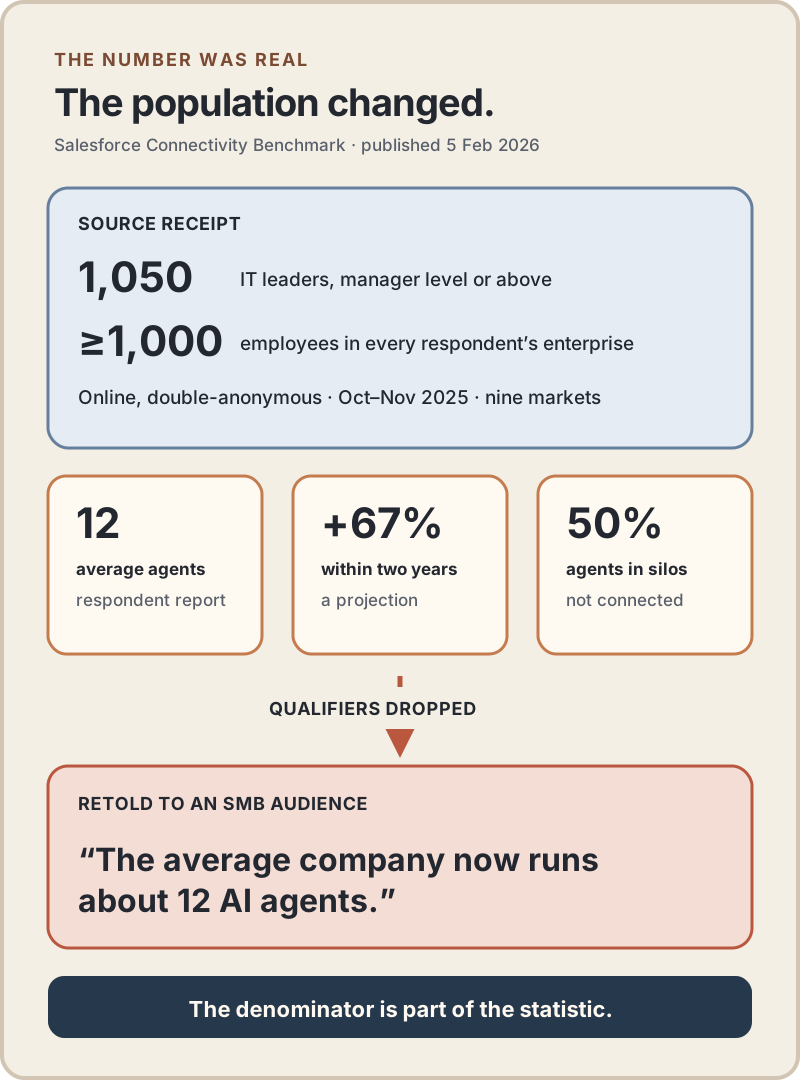
Three other qualifiers matter. Twelve is a mean, not a median or a maturity threshold. The 67% is a projection from respondents, not observed adoption growth. And 50% is a share of reported agents across the survey; it does not license the neat picture that a typical company owns twelve agents and six are disconnected.
The pairing still points cleanly back to Salesforce, but the newsletter gave no citation, so I cannot establish whether it copied Salesforce directly or through an intermediary. I also still cannot locate a primary instrument for its separate claim that three-or-more-agent production deployments jumped from 6% to 22%. That claim stays out. One traceable number does not confer provenance on the paragraph around it.
Gartner is a different denominator
Gartner’s April 2026 Hype Cycle article says 17% of organisations had deployed AI agents and more than 60% expected to do so within two years, attributing those figures to its 2026 CIO and Technology Executive Survey.
That looks incompatible with Salesforce’s average of twelve only if both surveys counted the same thing in the same population. The public Gartner page does not disclose the sample size or organisation-size threshold beside the figure. Salesforce asks enterprise IT leaders about an agent count; Gartner reports organisation-level deployment. “How many agents?” and “has your organisation deployed an agent?” are not interchangeable measures.
Claims that “31% have one in production” and “89% of pilots never scale” lack a primary instrument in the cited evidence. They cannot resolve the comparison. The surveys may differ, but the public evidence here does not reconcile them.
Make the denominator travel
The old rule—name who asked, whom, when and how many—was necessary but not sufficient. I had the right checklist and failed it in my own article. The replacement is a six-line receipt that travels with any adoption statistic:
- publisher and instrument;
- field dates and sample size;
- respondent role and organisation-size threshold;
- exact thing counted;
- current observation, estimate or forecast;
- wording allowed in the deck.
For Salesforce, the final line reads: “1,050 IT leaders at enterprises with 1,000-plus employees reported an average of 12 agents; respondents projected 67% growth within two years; half of reported agents were siloed.” It does not read “the average company has twelve.”
This is the same buying discipline behind AI ROI headlines choose their denominator: a number can be accurately copied and still become false when its cut or population is stripped away. Citation checking gets you to the table. Denominator checking tells you what sentence the table permits.
What the survey actually licenses
For a large-enterprise IT team, Salesforce’s result is useful. If half of the agents your peers report are isolated, inventory and governance deserve attention before another orchestration layer arrives. I would start by counting owners, credentials, data domains and active handoffs—not by trying to reach twelve.
For an SMB reader, the number is not a benchmark. It cannot tell you that you are behind, that multi-agent architecture is standard, or that an orchestration purchase is urgent. Salesforce’s product interest does not invalidate the survey, but it is another reason to keep reported adoption separate from the architecture being sold beside it.
The primary source exists, but the newsletter dropped its population. The published surveys do not provide a respondent-level dataset or a verified client fleet, so their averages should not be treated as a deployment inventory.
A primary source can still mislead after its denominator falls off—make the population travel with the number.